Przejdź do głównej zawartości

Jak ukryć zerowe etykiety danych na wykresie w programie Excel?

Czasami możesz dodać etykiety danych na wykresie, aby wartość danych była wyraźniejsza i bezpośrednio w programie Excel. Ale w niektórych przypadkach na wykresie nie ma etykiet danych i możesz chcieć ukryć te zerowe etykiety danych. Tutaj opowiem ci w szybki sposób, aby od razu ukryć zerowe etykiety danych w programie Excel.

Ukryj zerowe etykiety danych na wykresie


strzałka niebieski prawy bąbelek Ukryj zerowe etykiety danych na wykresie

Jeśli chcesz ukryć zerowe etykiety danych na wykresie, wykonaj następujące czynności:

1. Kliknij prawym przyciskiem myszy jedną z etykiet danych i wybierz Formatuj etykiety danych z menu kontekstowego. Zobacz zrzut ekranu:

dokument-ukryj-zero-data-etykieta-1

2. w Formatuj etykiety danych kliknij Numer w lewym okienku, a następnie wybierz Niestandardowe z kategorii pole listy i wpisz # „” do Kod formatu pole tekstowe i kliknij Dodaj przycisk, aby go dodać Rodzaj Nieruchomości skrzynka na listy. Zobacz zrzut ekranu:

dokument-ukryj-zero-data-etykieta-2

3. kliknij Zamknij aby zamknąć okno dialogowe. Wtedy widać, że wszystkie zerowe etykiety danych są ukryte.
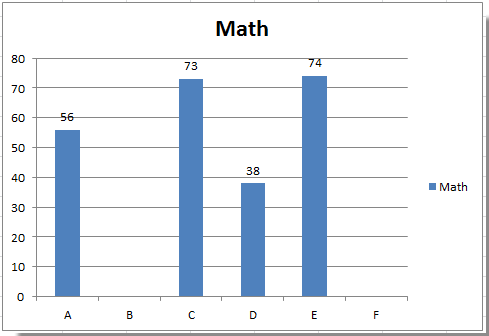
dokument-ukryj-zero-data-etykieta-3

Wskazówka: Jeśli chcesz wyświetlić zerowe etykiety danych, wróć do okna dialogowego Formatuj etykiety danych i kliknij Numer > Zamówienia Indywidualnei wybierz #, ## 0; - #, ## 0 Rodzaj Nieruchomości skrzynka na listy.

Note: W programie Excel 2013 możesz kliknąć prawym przyciskiem myszy dowolną etykietę danych i wybrać Formatuj etykiety danych otworzyć Formatuj etykiety danych szkło; następnie kliknij Numer rozszerzyć swoją opcję; następnie kliknij Kategoria i wybierz Zamówienia Indywidualne z listy rozwijanej i wpisz # „” do Kod formatu pole tekstowe i kliknij Dodaj przycisk.
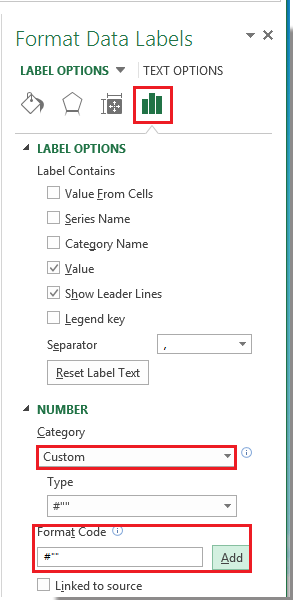
dokument-ukryj-zero-data-etykieta-4


Względne artykuły:

Najlepsze narzędzia biurowe

🤖 Pomocnik AI Kutools: Zrewolucjonizuj analizę danych w oparciu o: Inteligentne wykonanie   |  Wygeneruj kod  |  Twórz niestandardowe formuły  |  Analizuj dane i generuj wykresy  |  Wywołaj funkcje Kutools...
Popularne funkcje: Znajdź, wyróżnij lub zidentyfikuj duplikaty   |  Usuń puste wiersze   |  Łącz kolumny lub komórki bez utraty danych   |   Okrągły bez wzoru ...
Super wyszukiwanie: Wiele kryteriów VLookup    Wiele wartości VLookup  |   Przeglądanie pionowe na wielu arkuszach   |   Wyszukiwanie rozmyte ....
Zaawansowana lista rozwijana: Szybko twórz listę rozwijaną   |  Zależna lista rozwijana   |  Lista rozwijana wielokrotnego wyboru ....
Menedżer kolumn: Dodaj określoną liczbę kolumn  |  Przesuń kolumny  |  Przełącz stan widoczności ukrytych kolumn  |  Porównaj zakresy i kolumny ...
Polecane funkcje: Fokus siatki   |  Widok projektu   |   Duży pasek formuły    Menedżer skoroszytów i arkuszy   |  Biblioteka zasobów (Automatyczny tekst)   |  Selektor dat   |  Połącz arkusze   |  Szyfruj/odszyfruj komórki    Wysyłaj e-maile według listy   |  Super filtr   |   Specjalny filtr (filtruj pogrubienie/kursywa/przekreślenie...) ...
15 najlepszych zestawów narzędzi12 Tekst Tools (Dodaj tekst, Usuń znaki, ...)   |   50 + Wykres rodzaje (Wykres Gantta, ...)   |   40+ Praktyczne Wzory (Oblicz wiek na podstawie urodzin, ...)   |   19 Wprowadzenie Tools (Wstaw kod QR, Wstaw obraz ze ścieżki, ...)   |   12 Konwersja Tools (Liczby na słowa, Przeliczanie walut, ...)   |   7 Połącz i podziel Tools (Zaawansowane wiersze łączenia, Podział komórki, ...)   |   ... i więcej

Zwiększ swoje umiejętności Excela dzięki Kutools for Excel i doświadcz wydajności jak nigdy dotąd. Kutools dla programu Excel oferuje ponad 300 zaawansowanych funkcji zwiększających produktywność i oszczędzających czas.  Kliknij tutaj, aby uzyskać funkcję, której najbardziej potrzebujesz...

Opis


Karta Office wprowadza interfejs z zakładkami do pakietu Office i znacznie ułatwia pracę

  • Włącz edycję i czytanie na kartach w programach Word, Excel, PowerPoint, Publisher, Access, Visio i Project.
  • Otwieraj i twórz wiele dokumentów w nowych kartach tego samego okna, a nie w nowych oknach.
  • Zwiększa produktywność o 50% i redukuje setki kliknięć myszką każdego dnia!
Comments (15)
No ratings yet. Be the first to rate!
This comment was minimized by the moderator on the site
Muito obrigado!
This comment was minimized by the moderator on the site
Depending on your data set, you could use a helper column. The formula could use rounddown or IF(cell<1,0,cell). This way your slicers stay intact and your pie chart uses the new column.
This comment was minimized by the moderator on the site
I have a pivot chart (pie chart) where I need to remove the labels for any slice of the pie with a value under 1%. Right now, these are displayed as 0% (no decimal places). I am also using slicers to analyse the data by month, department and person. I am trying to get the chart to hide any labels where the value is less than 1%, but this will change when I change the variables in the slicers. I have fallen down a rabbit-hole here trying to figure this out.
This comment was minimized by the moderator on the site
The Microsoft way of doing it (though not found on ana MS help page) is to click File>Options>Advanced, scroll down to 'Display options for this worksheet', and uncheck / untick 'Show a zero in cells that have a zero value'. All the zeros disappear.

I seem to have found a way to remove the axis name and space on a graph or chart for zero values: Highlight the whole table, click Home>Sort and filter>Filter, Click on the header of the column with the blank zero values, and uncheck / untick 'Blanks'.
This comment was minimized by the moderator on the site
Thanks that really works well for me.
This comment was minimized by the moderator on the site
tnx, it works
This comment was minimized by the moderator on the site
How can I hide Zero Data Labels when it is percentage (for example 0,00%, I do not want that label to be shown)?
This comment was minimized by the moderator on the site
<span style="letter-spacing: 0.2px; color: inherit; font-family: inherit; font-style: inherit; font-variant-ligatures: inherit; font-variant-caps: inherit; font-weight: inherit;">0.0%;-0.0%;""    </span>
This comment was minimized by the moderator on the site
Hi
Thank you for sharing the solution above. It was really great help. However, after hiding zero values, I am having difficulties with hiding their labels. Can you please give a solution for that problem, too? Thank in advance for your help.
This comment was minimized by the moderator on the site
Found this solution absolutely useful. Thanks a ton.
This comment was minimized by the moderator on the site
Great solution! Can this be done retaining decimal points on the numbers that do appear?
This comment was minimized by the moderator on the site
Kelcey, use: #,##"";-#,##""; When using the second semicolon, you define what happens in case of zero. So, if you don't define anything, the value stays blank.
This comment was minimized by the moderator on the site
I use 0.0;;; and it also does the trick, in terms of retaining decimal places. You'd just adjust to the # of sig figs you want to keep. You have to assign the custom value to each data label series, but it keeps that format each time you refresh the data.
There are no comments posted here yet
Load More
Please leave your comments in English
Posting as Guest
×
Rate this post:
0   Characters
Suggested Locations