Przejdź do głównej zawartości

Jak zmienić kolor kształtu na podstawie wartości komórki w programie Excel?

Zmiana koloru kształtu na podstawie określonej wartości komórki może być interesującym zadaniem w programie Excel, na przykład, jeśli wartość komórki w A1 jest mniejsza niż 100, kolor kształtu jest czerwony, jeśli A1 jest większe niż 100 i mniejsze niż 200, kolor kształtu jest żółty, a gdy A1 jest większe niż 200, kolor kształtu jest zielony, jak pokazano na zrzucie ekranu. Aby zmienić kolor kształtu na podstawie wartości komórki, w tym artykule przedstawimy metodę.

doc zmień kolor kształtu 1

Zmień kolor kształtu na podstawie wartości komórki za pomocą kodu VBA


strzałka niebieski prawy bąbelek Zmień kolor kształtu na podstawie wartości komórki za pomocą kodu VBA

Poniższy kod VBA może pomóc w zmianie koloru kształtu na podstawie wartości komórki, wykonaj następujące czynności:

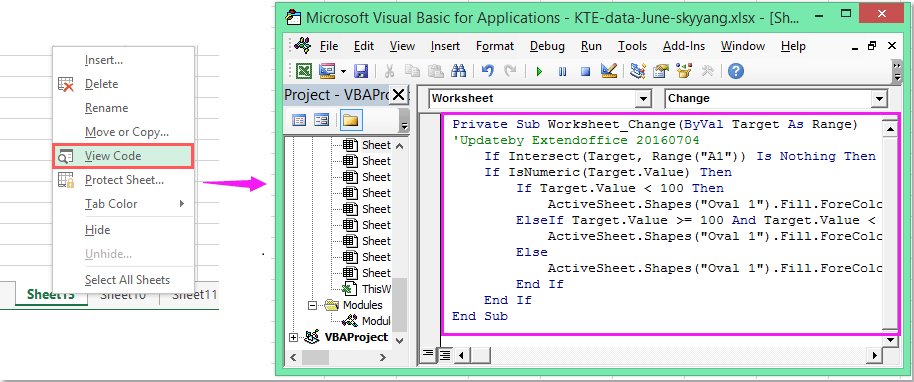
1. Kliknij prawym przyciskiem myszy kartę arkusza, w której chcesz zmienić kolor kształtu, a następnie wybierz Wyświetl kod z menu kontekstowego w wyskakującym pliku Microsoft Visual Basic for Applications okno, skopiuj i wklej następujący kod w puste miejsce Moduł okno.

Kod VBA: Zmień kolor kształtu na podstawie wartości komórki:

Private Sub Worksheet_Change(ByVal Target As Range)
'Updateby Extendoffice 20160704
    If Intersect(Target, Range("A1")) Is Nothing Then Exit Sub
    If IsNumeric(Target.Value) Then
        If Target.Value < 100 Then
            ActiveSheet.Shapes("Oval 1").Fill.ForeColor.RGB = vbRed
        ElseIf Target.Value >= 100 And Target.Value < 200 Then
            ActiveSheet.Shapes("Oval 1").Fill.ForeColor.RGB = vbYellow
        Else
            ActiveSheet.Shapes("Oval 1").Fill.ForeColor.RGB = vbGreen
        End If
    End If
End Sub

doc zmień kolor kształtu 2

2. A następnie, gdy wprowadzisz wartość w komórce A1, kolor kształtu zostanie zmieniony na wartość komórki zgodnie z definicją.

Note: W powyższym kodzie, A1 to wartość komórki, na podstawie której zmieniłby się kolor kształtu, a Owalny 1 to nazwa kształtu wstawionego kształtu, możesz je zmienić według potrzeb.

Najlepsze narzędzia biurowe

🤖 Pomocnik AI Kutools: Zrewolucjonizuj analizę danych w oparciu o: Inteligentne wykonanie   |  Wygeneruj kod  |  Twórz niestandardowe formuły  |  Analizuj dane i generuj wykresy  |  Wywołaj funkcje Kutools...
Popularne funkcje: Znajdź, wyróżnij lub zidentyfikuj duplikaty   |  Usuń puste wiersze   |  Łącz kolumny lub komórki bez utraty danych   |   Okrągły bez wzoru ...
Super wyszukiwanie: Wiele kryteriów VLookup    Wiele wartości VLookup  |   Przeglądanie pionowe na wielu arkuszach   |   Wyszukiwanie rozmyte ....
Zaawansowana lista rozwijana: Szybko twórz listę rozwijaną   |  Zależna lista rozwijana   |  Lista rozwijana wielokrotnego wyboru ....
Menedżer kolumn: Dodaj określoną liczbę kolumn  |  Przesuń kolumny  |  Przełącz stan widoczności ukrytych kolumn  |  Porównaj zakresy i kolumny ...
Polecane funkcje: Fokus siatki   |  Widok projektu   |   Duży pasek formuły    Menedżer skoroszytów i arkuszy   |  Biblioteka zasobów (Automatyczny tekst)   |  Selektor dat   |  Połącz arkusze   |  Szyfruj/odszyfruj komórki    Wysyłaj e-maile według listy   |  Super filtr   |   Specjalny filtr (filtruj pogrubienie/kursywa/przekreślenie...) ...
15 najlepszych zestawów narzędzi12 Tekst Tools (Dodaj tekst, Usuń znaki, ...)   |   50 + Wykres rodzaje (Wykres Gantta, ...)   |   40+ Praktyczne Wzory (Oblicz wiek na podstawie urodzin, ...)   |   19 Wprowadzenie Tools (Wstaw kod QR, Wstaw obraz ze ścieżki, ...)   |   12 Konwersja Tools (Liczby na słowa, Przeliczanie walut, ...)   |   7 Połącz i podziel Tools (Zaawansowane wiersze łączenia, Podział komórki, ...)   |   ... i więcej

Zwiększ swoje umiejętności Excela dzięki Kutools for Excel i doświadcz wydajności jak nigdy dotąd. Kutools dla programu Excel oferuje ponad 300 zaawansowanych funkcji zwiększających produktywność i oszczędzających czas.  Kliknij tutaj, aby uzyskać funkcję, której najbardziej potrzebujesz...

Opis


Karta Office wprowadza interfejs z zakładkami do pakietu Office i znacznie ułatwia pracę

  • Włącz edycję i czytanie na kartach w programach Word, Excel, PowerPoint, Publisher, Access, Visio i Project.
  • Otwieraj i twórz wiele dokumentów w nowych kartach tego samego okna, a nie w nowych oknach.
  • Zwiększa produktywność o 50% i redukuje setki kliknięć myszką każdego dnia!
Comments (22)
Rated 4 out of 5 · 1 ratings
This comment was minimized by the moderator on the site
how would be the VBA code to paint several autoforms according to a range of data?
the values are in column B and I have 20 autoforms.
This comment was minimized by the moderator on the site
Como faço para para variar as cores da forma se minha opções for em formato de texto, como "Sim" e "Não"?
This comment was minimized by the moderator on the site
Hello, Emilly
To solve your problem, please apply the below code:
Private Sub Worksheet_Change(ByVal Target As Range)
If Range("A1") = "Yes" Then
ActiveSheet.Shapes("Oval 1").Fill.ForeColor.RGB = vbRed
Else
If Range("A1") = "No" Then
ActiveSheet.Shapes("Oval 1").Fill.ForeColor.RGB = vbGreen
End If
End If
End Sub


Please have a try, hope it can help you!
This comment was minimized by the moderator on the site
Hi Skyyang,

I tried the original VBA code and got it to work, although it would not activate actively when the cell changed. Today the code is not working and I also tried your more simplistic code and still did not work. The only thing that changed is that I copied the worksheet which contained the code that worked. Would this then result in it not working?
This comment was minimized by the moderator on the site
Hola, excelente ejemplo.
Pero como seria si tengo una forma y quiero ir coloreado poco a poco dependiendo del valor ejemplo:
Si el valor es 50%
Seia mitad roja y mitad verde
Pero que se vaya llenando según el porcentaje vaya aumentando
Rated 4 out of 5
This comment was minimized by the moderator on the site
I am new to VBAs and am struggling with something. I need to have 9 different cells A1-A9 change the colour of 9 different objects. Objects are cubes 1-9. Just to clarify, each cell is to change just one object A1-Cube 1, etc. Red if it fails to meet the value and green if it exceeds the value. The pass/fail value can change so instead of having the value in the VBA I need it to reference cell A10 which has the pass/fail value. Any chance someone could through out a sample code for me to work with.

Thanks
This comment was minimized by the moderator on the site
Great solution! How can I do if I have more than 1 oval in the worksheet which the colors change according to the value input say in A1, B1,C1? Thanks in advance for your reply! 
This comment was minimized by the moderator on the site
Hello mnsosa,Glad to help. Please copy and paste the below VBA code into the blank Module window.
Sub TestMacro2()
Dim dblHt As Double
Dim rngC As Range
Dim lngr As Long
Dim dblMargin As Double
Dim lngSR As Long

lngSR = 2 'Row where the data starts

dblMargin = 6 ' Distance between shapes

'On Error Resume Next
ActiveSheet.Shapes.SelectAll
Selection.Delete
On Error GoTo 0


dblHt = Rows(lngSR).Height * 4

For lngr = lngSR To Cells(lngSR, "A").End(xlDown).Row
ActiveSheet.Shapes.AddShape(msoShapeOval, _
Cells(lngSR, "D").Left + ((lngr - lngSR) Mod 4) * dblHt + dblMargin, _
Cells(lngSR, "D").Top + Int((lngr - lngSR) / 4) * dblHt + dblMargin, _
dblHt - 2 * dblMargin, _
dblHt - 2 * dblMargin).Select
Selection.Name = "Round" & Cells(lngr, "A").Address
Selection.ShapeRange.TextFrame2.VerticalAnchor = msoAnchorMiddle
Selection.ShapeRange(1).TextFrame2.TextRange.Characters.Text = Cells(lngr, "A").Value
With Selection.ShapeRange(1).TextFrame2.TextRange.Characters(1, 2).ParagraphFormat
.FirstLineIndent = 0
.Alignment = msoAlignCenter
End With
With Selection.ShapeRange(1).TextFrame2.TextRange.Characters(1, 2).Font
.Bold = msoTrue
.Fill.Visible = msoTrue
.Fill.ForeColor.ObjectThemeColor = msoThemeColorText1
.Fill.ForeColor.TintAndShade = 0
.Fill.ForeColor.Brightness = 0
.Fill.Transparency = 0
.Fill.Solid
.Size = 12
End With
With Selection.ShapeRange.Fill
.Visible = msoTrue
If Cells(lngr, "A").Value > 70 Then
.ForeColor.RGB = RGB(0, 176, 80)
ElseIf Cells(lngr, "A").Value >= 40 Then
.ForeColor.RGB = RGB(255, 255, 70)
Else
.ForeColor.RGB = RGB(255, 0, 0)
End If
.Transparency = 0
.Solid
End With
Next lngr
Range("A1").Select
End Sub

After you run the VBA code above, you will see multiple shapes are generated, and the colors of these shapes are changed according to the VBA.Please see my screenshot. Hope it can help. Have a nice day.Sincerely,Mandy
This comment was minimized by the moderator on the site
¿Cómo hacemos si tenemos más de 1 Oval en la hoja de trabajo cuyos colores cambian de acuerdo con el valor ingresado, por ejemplo, en A1, B1, C1...? Mil gracias por su ayuda!

This comment was minimized by the moderator on the site
Hello María Noel,
Glad to help. Please copy and paste the below VBA code into the blank Module window.

Sub TestMacro2()
Dim dblHt As Double
Dim rngC As Range
Dim lngr As Long
Dim dblMargin As Double
Dim lngSR As Long

lngSR = 2 'Row where the data starts

dblMargin = 6 ' Distance between shapes

'On Error Resume Next
ActiveSheet.Shapes.SelectAll
Selection.Delete
On Error GoTo 0


dblHt = Rows(lngSR).Height * 4

For lngr = lngSR To Cells(lngSR, "A").End(xlDown).Row
ActiveSheet.Shapes.AddShape(msoShapeOval, _
Cells(lngSR, "D").Left + ((lngr - lngSR) Mod 4) * dblHt + dblMargin, _
Cells(lngSR, "D").Top + Int((lngr - lngSR) / 4) * dblHt + dblMargin, _
dblHt - 2 * dblMargin, _
dblHt - 2 * dblMargin).Select
Selection.Name = "Round" & Cells(lngr, "A").Address
Selection.ShapeRange.TextFrame2.VerticalAnchor = msoAnchorMiddle
Selection.ShapeRange(1).TextFrame2.TextRange.Characters.Text = Cells(lngr, "A").Value
With Selection.ShapeRange(1).TextFrame2.TextRange.Characters(1, 2).ParagraphFormat
.FirstLineIndent = 0
.Alignment = msoAlignCenter
End With
With Selection.ShapeRange(1).TextFrame2.TextRange.Characters(1, 2).Font
.Bold = msoTrue
.Fill.Visible = msoTrue
.Fill.ForeColor.ObjectThemeColor = msoThemeColorText1
.Fill.ForeColor.TintAndShade = 0
.Fill.ForeColor.Brightness = 0
.Fill.Transparency = 0
.Fill.Solid
.Size = 12
End With
With Selection.ShapeRange.Fill
.Visible = msoTrue
If Cells(lngr, "A").Value > 70 Then
.ForeColor.RGB = RGB(0, 176, 80)
ElseIf Cells(lngr, "A").Value >= 40 Then
.ForeColor.RGB = RGB(255, 255, 70)
Else
.ForeColor.RGB = RGB(255, 0, 0)
End If
.Transparency = 0
.Solid
End With
Next lngr
Range("A1").Select
End Sub

After you run the VBA code above, you will see multiple shapes are generated, and the colors of these shapes are changed according to the VBA.
Please see my screenshot. Hope it can help. Have a nice day.
Sincerely,
Mandy
This comment was minimized by the moderator on the site
Hi... excellent solution... but how do I apply it to multiple shapes based on the corresponding values of a range of cells. Many thanks in advance for your help.
This comment was minimized by the moderator on the site
Hello Ryan,
Glad to help. Please copy and paste the below VBA code into the blank Module window.

Sub TestMacro2()
Dim dblHt As Double
Dim rngC As Range
Dim lngr As Long
Dim dblMargin As Double
Dim lngSR As Long

lngSR = 2 'Row where the data starts

dblMargin = 6 ' Distance between shapes

'On Error Resume Next
ActiveSheet.Shapes.SelectAll
Selection.Delete
On Error GoTo 0


dblHt = Rows(lngSR).Height * 4

For lngr = lngSR To Cells(lngSR, "A").End(xlDown).Row
ActiveSheet.Shapes.AddShape(msoShapeOval, _
Cells(lngSR, "D").Left + ((lngr - lngSR) Mod 4) * dblHt + dblMargin, _
Cells(lngSR, "D").Top + Int((lngr - lngSR) / 4) * dblHt + dblMargin, _
dblHt - 2 * dblMargin, _
dblHt - 2 * dblMargin).Select
Selection.Name = "Round" & Cells(lngr, "A").Address
Selection.ShapeRange.TextFrame2.VerticalAnchor = msoAnchorMiddle
Selection.ShapeRange(1).TextFrame2.TextRange.Characters.Text = Cells(lngr, "A").Value
With Selection.ShapeRange(1).TextFrame2.TextRange.Characters(1, 2).ParagraphFormat
.FirstLineIndent = 0
.Alignment = msoAlignCenter
End With
With Selection.ShapeRange(1).TextFrame2.TextRange.Characters(1, 2).Font
.Bold = msoTrue
.Fill.Visible = msoTrue
.Fill.ForeColor.ObjectThemeColor = msoThemeColorText1
.Fill.ForeColor.TintAndShade = 0
.Fill.ForeColor.Brightness = 0
.Fill.Transparency = 0
.Fill.Solid
.Size = 12
End With
With Selection.ShapeRange.Fill
.Visible = msoTrue
If Cells(lngr, "A").Value > 70 Then
.ForeColor.RGB = RGB(0, 176, 80)
ElseIf Cells(lngr, "A").Value >= 40 Then
.ForeColor.RGB = RGB(255, 255, 70)
Else
.ForeColor.RGB = RGB(255, 0, 0)
End If
.Transparency = 0
.Solid
End With
Next lngr
Range("A1").Select
End Sub

After you run the VBA code above, you will see multiple shapes are generated, and the colors of these shapes are changed according to the VBA.
Please see my screenshot. Hope it can help. Have a nice day.
Sincerely,
Mandy
This comment was minimized by the moderator on the site
How do I make the private sub to read the result from the AVERAGE(C1,C5,C9) calculation?

Sub only works with numeric values; any thoughts and suggestions are greatly appreciated.
This comment was minimized by the moderator on the site
Hello Cesare,How are you? I notice that the VBA code can work with the AVERAGE(number, number...) calculation. But the trick is that every time you change the values in the calculation, you need to double-click the formula in the cell to make the VBA work again. 
For example, In cell A1, after we input the formula is =AVERAGE(C2:D3), the VBA works and changes the color of the shape accordingly. Please see screenshot 1. <span style="letter-spacing: 0.2px; color: inherit; font-family: inherit; font-style: inherit; font-variant-ligatures: inherit; font-variant-caps: inherit; font-weight: inherit;">C2:D3, the returned result in cell A1 changes, but the shape color hasn't been changed yet. In this case, we need to double click the formula in cell A1 to make the VBA work. Then the shape color will be changed accordingly. Please see screenshots 2 and 3.</span>
This comment was minimized by the moderator on the site
Thanks for this which is really useful.

I now want to use it with a pivot table on another worksheet which controls the data on the sheet with the shapes that I want to change colour. However, when I change the selection on the pivot table the data on the worksheet with the shapes is updated but the code does not run so the shapes do not change colour

If I manually change the values the code runs and the colour of the shapes is updated.

Question: what do i need to add to the code above to allow it to run automatically?
This comment was minimized by the moderator on the site
How can this be applied if you have multiple shape in the same worksheet?
This comment was minimized by the moderator on the site
Hello Yasir,
Glad to help. Please copy and paste the below VBA code into the blank Module window.

Sub TestMacro2()
Dim dblHt As Double
Dim rngC As Range
Dim lngr As Long
Dim dblMargin As Double
Dim lngSR As Long

lngSR = 2 'Row where the data starts

dblMargin = 6 ' Distance between shapes

'On Error Resume Next
ActiveSheet.Shapes.SelectAll
Selection.Delete
On Error GoTo 0


dblHt = Rows(lngSR).Height * 4

For lngr = lngSR To Cells(lngSR, "A").End(xlDown).Row
ActiveSheet.Shapes.AddShape(msoShapeOval, _
Cells(lngSR, "D").Left + ((lngr - lngSR) Mod 4) * dblHt + dblMargin, _
Cells(lngSR, "D").Top + Int((lngr - lngSR) / 4) * dblHt + dblMargin, _
dblHt - 2 * dblMargin, _
dblHt - 2 * dblMargin).Select
Selection.Name = "Round" & Cells(lngr, "A").Address
Selection.ShapeRange.TextFrame2.VerticalAnchor = msoAnchorMiddle
Selection.ShapeRange(1).TextFrame2.TextRange.Characters.Text = Cells(lngr, "A").Value
With Selection.ShapeRange(1).TextFrame2.TextRange.Characters(1, 2).ParagraphFormat
.FirstLineIndent = 0
.Alignment = msoAlignCenter
End With
With Selection.ShapeRange(1).TextFrame2.TextRange.Characters(1, 2).Font
.Bold = msoTrue
.Fill.Visible = msoTrue
.Fill.ForeColor.ObjectThemeColor = msoThemeColorText1
.Fill.ForeColor.TintAndShade = 0
.Fill.ForeColor.Brightness = 0
.Fill.Transparency = 0
.Fill.Solid
.Size = 12
End With
With Selection.ShapeRange.Fill
.Visible = msoTrue
If Cells(lngr, "A").Value > 70 Then
.ForeColor.RGB = RGB(0, 176, 80)
ElseIf Cells(lngr, "A").Value >= 40 Then
.ForeColor.RGB = RGB(255, 255, 70)
Else
.ForeColor.RGB = RGB(255, 0, 0)
End If
.Transparency = 0
.Solid
End With
Next lngr
Range("A1").Select
End Sub

After you run the VBA code above, you will see multiple shapes are generated, and the colors of these shapes are changed according to the VBA.
Please see my screenshot. Hope it can help. Have a nice day.
Sincerely,
Mandy
There are no comments posted here yet
Load More
Please leave your comments in English
Posting as Guest
×
Rate this post:
0   Characters
Suggested Locations